


The 4 UX metrics that matter
Why most product/UX/UR designers track the wrong stuff.

TL;DR
UX metrics help teams make smarter decisions by showing where users succeed, struggle, and drop off. But with 70+ metrics to choose from, most teams get lost in the data. Here’s a simpler way: focus on just 4 metrics that actually reflect the real user experience — especially if you work in personalization or product optimization.
There are 70+ UX Metrics.
But let’s be honest: 70+ UX metrics? Ain’t nobody got time for that.
You only need 4!!!

If you care about real impact — smoother experiences, fewer drop-offs, and products people enjoy — start here.
I’ve tested a lot of metrics. Some look good on slides. Some win arguments. But only a few help you make better product decisions. These are the four I keep coming back to in my product design work:
Task Completion Rate (TCR)

What it measures: Effectiveness
Why it matters: No completion = no value delivered
Use it for: Flows, features, onboarding
2. Single Ease Question (SEQ)
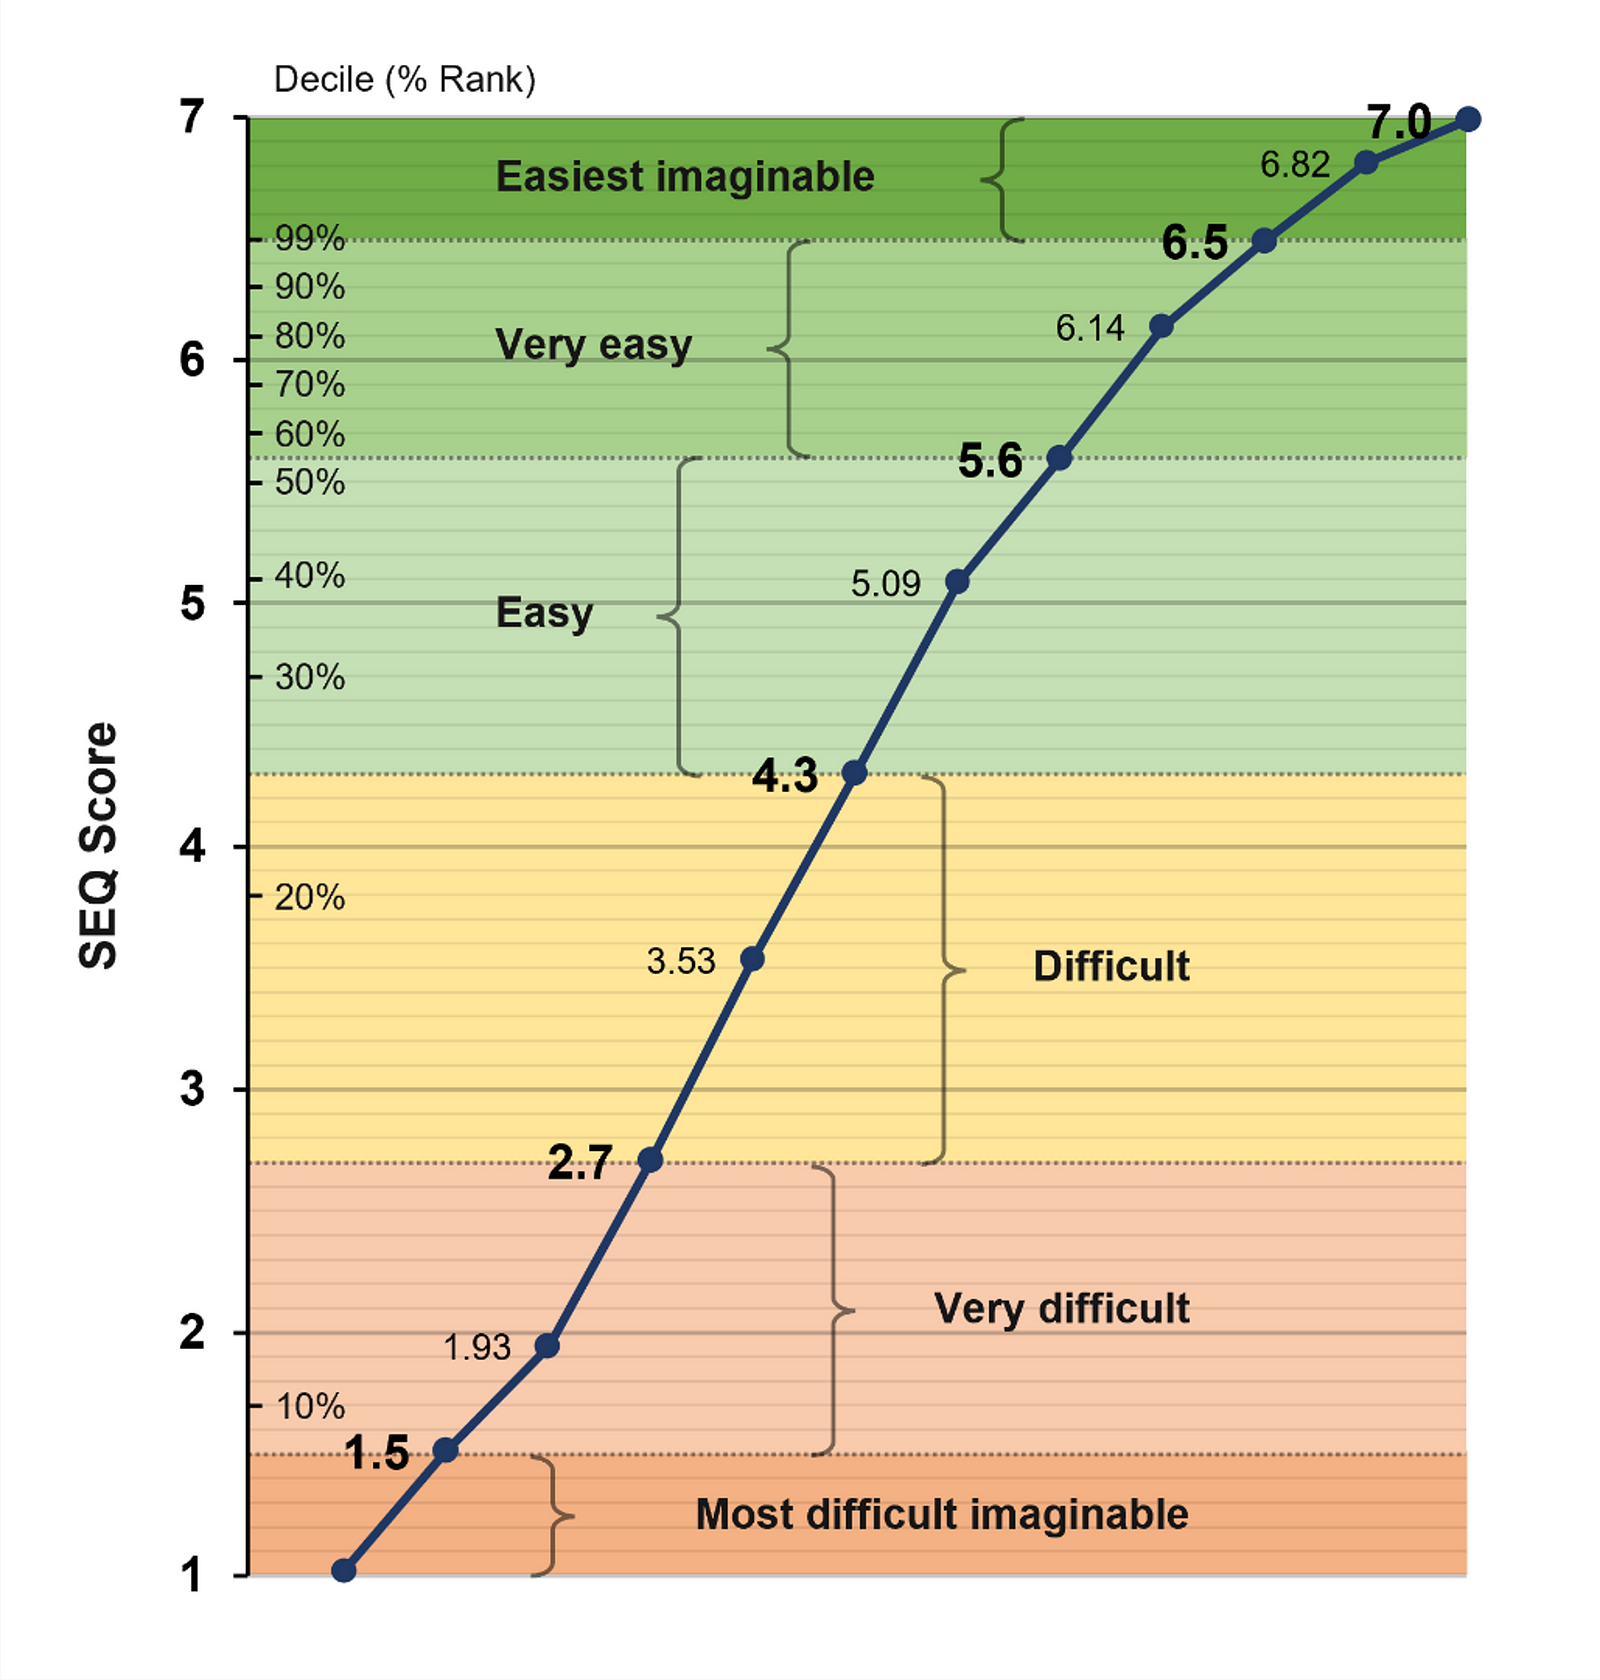
What it is: After a task, ask: “How easy was this?” (1 = hard, 7 = easy)
Why I care: This is the quickest pulse check on perceived usability.
How we use it in personalization: We often test if a dynamic homepage or personalized CTA actually makes life easier, not harder.
3. Time on Task (TOT)

What it is: How long it takes to complete a task.
Why I care: Speed matters, but context matters more. Longer time isn’t always bad — unless it comes with frustration.
Caveat: Don’t chase faster if it leads to worse decisions (e.g., rushed purchases or bounces).
4. UX-Lite

What it is: A quick 2-question study measuring perceived ease-of-use and usefulness.
Why I care: It’s the MVP of attitudinal study-level metrics — simple, scalable, and surprisingly insightful.
When to use: Post-test surveys, especially after a new personalization feature rollout.
Why these 4?
Completion = success
SEQ = effort
Time = efficiency
UX-Lite = perception
Together, they give you a 360° view of what users do and how they feel.
Skip the fancy, start with impact
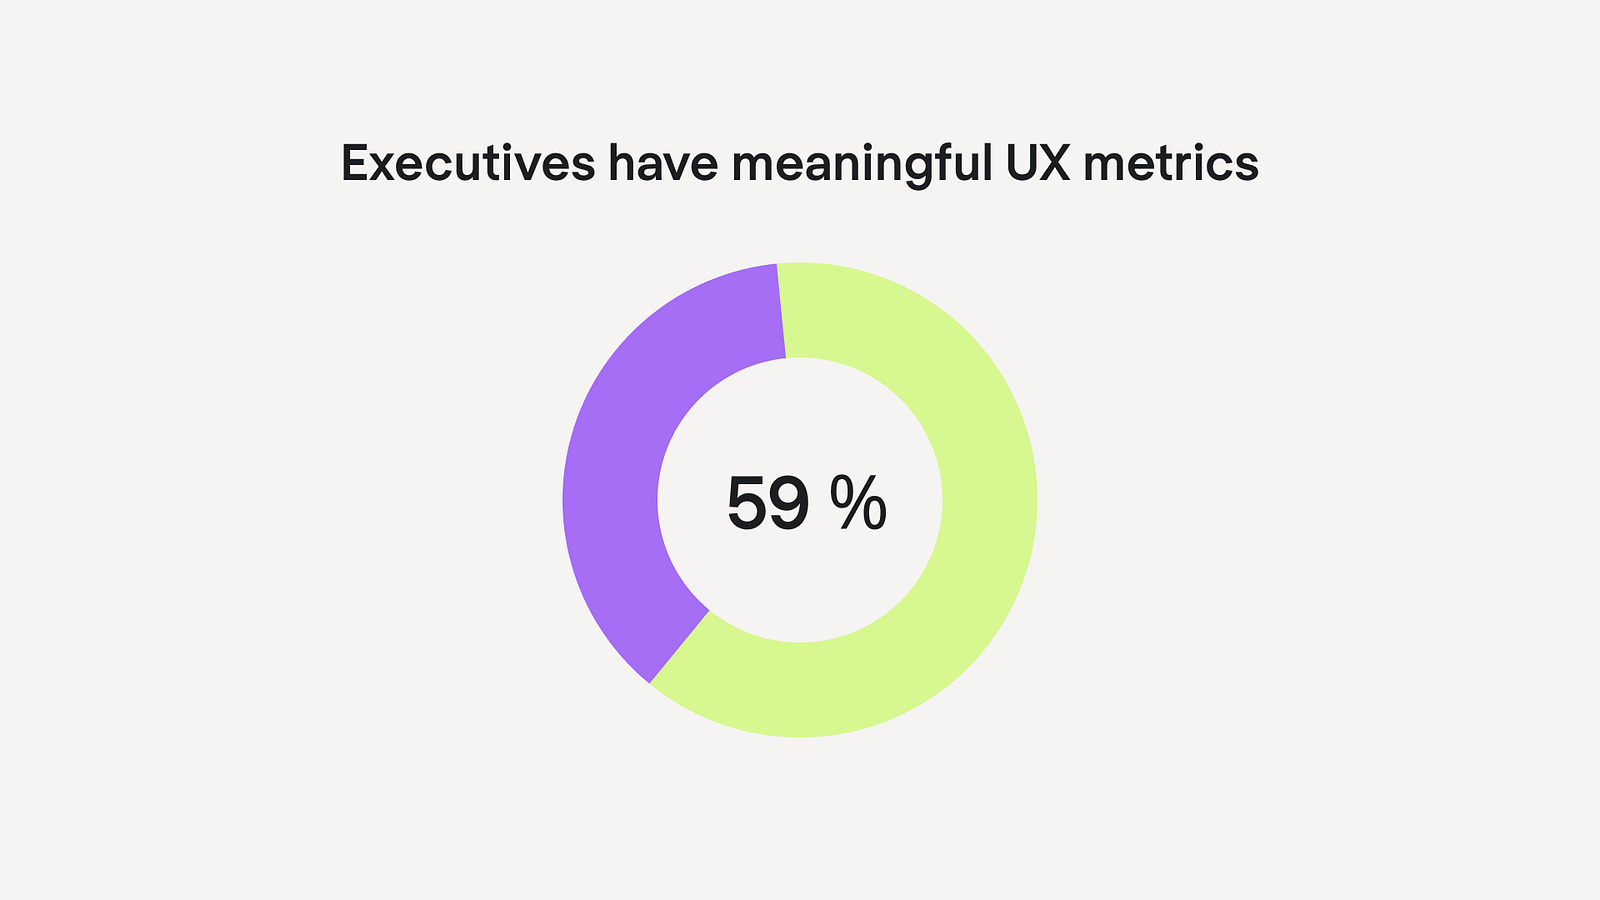
UserZoom survey has shown that 81% of executives recognize the value of UX, but only 59% of them claim that they can effectively measure it.
I’ve seen teams obsess over niche metrics like EEG signals or eye-tracking heatmaps. Cool? Yes. Useful? Rarely.
Instead, build a reliable metrics stack. Start with these 4. Nail the basics. Add the fancy stuff later.
Want to geek out with the full 70+ UX metrics taxonomy? Check out the visual here: MeasuringU UX Metrics Map
Happy to share.
👋 Let’s be friends! Follow me on Substack, on X, and connect with me on LinkedIn. Don’t forget to follow me here on Medium as well for more design-related content.
Recommended to read:
What is usability testing? The beginner guide, tools, and types.
Discover how to enhance your user experience projects with the most effective usability testing tools, types, available…medium.com
UX Atomic Research: All you need to know
What is Atomic Research? Why we need it? Practical way of implementing it into your UX Research.medium.com
Homepage usability: a guide to enhancing UX and web design
Explore essential usability guidelines and best practices to optimize your website’s homepage for every usermedium.com
What is the MECE Principle: a product designer’s guide to clarity and impact
MECE is an acronym for the phrase Mutually Exclusive, Collectively Exhaustive. Put simply, it is a principle that will…medium.com